 |
Alex Tsariounov
Hewlett-Packard Company
3404 E. Harmony Rd., MS42
Fort Collins, CO 80528
alex_tsariounov@hp.com
Bob Montgomery
Hewlett-Packard Company
3404 E. Harmony Rd., MS42
Fort Collins, CO 80528
bob_montgomery@hp.com
May 1, 2002
Prospect has a history on the HPUX operating system where it was invented in 1988. In the last year's time frame, we have moved this profiler to Linux with the aid of the sampling module oprofile released under GPL by John Levon while at the Victoria University of Manchester, UK. We describe the interface to oprofile, the data structures and algorithms used to collect and store the instruction pointer and system event data, and the symbol profile generation.
In 1988 Doug Baskins at HP wanted to know exactly what an HP-UX machine was doing during operations. He ended up designing and implementing the Kernel Instrumentation (KI) package (a kernel tracing facility) and a testing tool for it. The testing tool became valuable in its own right and was named ``Prospect'' after the gold prospectors of the past. Just as when one prospects for gold and finds the occasional nugget, so does one also use Prospect to find nuggets of performance data. The KI and Prospect live on to this day in modern HP-UX systems.
In the last year's time frame we have moved this idea to Linux where we needed such a performance analysis tool. Prospect produces flat symbol and assembly-level profiles through instruction pointer (IP) sampling. All applications running on the system are profiled and produce both user and kernel profiles. Prospect also generates kernel-only profiles in its reports. One can obtain profiles without undue requirements on the target applications. For example, there is no need to specially instrument the application and there is no need to rebuild or relink. In fact, the only requirement is that the applications not be stripped. Shared libraries escape this requirement for the most part as do assembly-level profiles.
Prospect on Linux uses the oprofile module developed by John Levon [Levon] while at the Victoria University of Manchester, UK. Oprofile is a neat project that uses the P6 performance counters to clock an NMI sampler and is an active GPL project at this time with growing contributions. The goals of oprofile and Prospect are similar though parallel and thus the two tools complement each other nicely.
Hewlett Packard has recently allowed Prospect to become Open Source and released it under the GNU General Public License Version 2. Hosting arrangements have not been determined yet for the project at the time of this paper.
In your exploration of HP's web sites you may find reference to an HP-UX version of Prospect. This is still an active project currently maintained by one of the authors but it is not Open Source. However, it is available for free for the HP-UX operating system and can be downloaded from ftp://ftp.cup.hp.com in the dist/networking/tools/prospect subdirectory. The HP-UX version of Prospect does not use oprofile or GDB in any way.
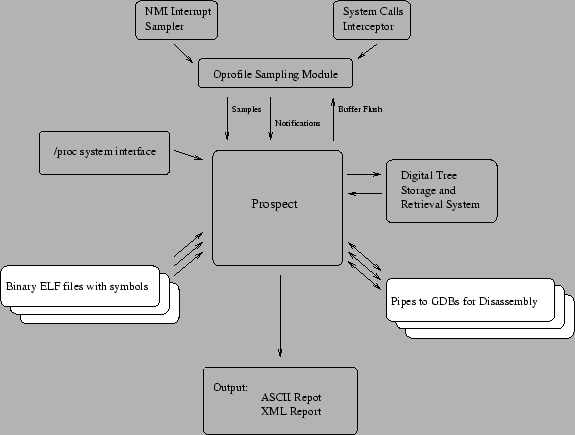
Figure 1 shows the overall architecture of Prospect. Note that not all parts are used all the time. In fact, there are several phases that Prospect goes through in the typical run that we describe later on.
As can be seen from Figure 1, Prospect has the following major architectural modules:
The short descriptions above give an overall picture of the functional modules involved in Prospect. To complete this picture, it is useful to see an enumeration of run time phases that the software shifts through for a typical run:
Now that we have a general idea of the Prospect architecture and control flow, this section will describe a few functional modules in greater detail. Three modules are of interest: the oprofile interface, the dtree digital tree implementation, and the GDB interface for assembly-level profile generation.
The oprofile project is a very active GPL project (see http://oprofile.sf.net) that provides an instruction pointer sampling mechanism that is clocked off the Pentium P61 series performance counters.2 The performance counter events are routed through the APIC to the NMI pin of the processor. The module registers a short sampling routine to the NMI vector that actually does the sampling. The instruction pointer samples are kept in a trick constant-size hash table in kernel memory and dumped to user space though a device interface file. Normal operation is to have the user-space daemon block on reading this file. When the kernel buffer nears capacity, or when a ``1'' is sent to the buffer flush /proc oprofile interface file, the read succeeds and the data is transfered. In addition to instruction pointer samples, the oprofile module also intercepts certain system calls and passes this trace through another device interface file. Finally, oprofile also keeps track of opened files in a hash table in kernel memory for determining the path of exec'ed and mmap'ed files. This hash table is accessible from user space and is normally memory mapped. All of this information taken in its entirety allows Prospect to generate its profiles.
Prospect acts as the user-space daemon functionality wise (and in fact replaces the oprofile user-space daemon for the purpose of Prospect), but is not a daemon at all and is removed from memory after every run (the oprofile module is left resident). Both Prospect and the oprofile tools have similar but different goals and so the tools complement each other nicely. The goal of Prospect was two-fold: (1) make oprofile trivially easy to use; (2) create a profile of all system activity specified within a certain time interval. This interstice of time is specified by the child of the Prospect process in the same manner as for the /bin/time command.
The oprofile tools were designed to unobtrusively run in the background, sampling system information continuously. Thus one would have a long term profiling record of all processes on the system. Also, the effects of short-lived processes are merged into single profile files identified by filenames in a /var location when you use the oprofile tools.
While there are a number of events that can be used to clock the oprofile sampling module, Prospect always uses the CPU_CLK_UNHALTED event by default. However, the setup code was written in such a way that if Prospect detects that oprofile was set up already at initialization time, then the existing set up is not changed. Thus you can use a different event to clock the sampler by using the op_start script supplied with the oprofile distribution. In effect, you can generate profiles based on any of the performance monitor events - see the oprofile documentation for details.
Using the oprofile modules entails the following interesting phases:
Next, Prospect goes through all processes currently existing in /proc and creates data structures for all of them indexed by PID. Prospect then reads in the System.map file and locates an uncompressed kernel image. If Prospect can't read in the System.map file then kernel profiles are disabled; if an uncompressed kernel image is not available, then disassembled kernel profiles will not be produced. You can specify both of these files with the -K and -L arguments - however, Prospect will check the specified System.map against /proc/ksyms and if they don't match, kernel profiles will not be available.
At this point, the oprofile devices are opened which starts profiling. Prospect next sets up the periodic alarm signal to flush the oprofile buffer. Now, Prospect fork's and exec's the command line that was passed to it and goes into the read-block loop on the oprofile device files.
The tradeoff when using periodic flushing with oprofile is deciding how much data the kernel gets to keep in the instruction pointer hash table by adjusting the periodic flush rate and balancing that against the bounding time interval. The further apart the periodic flush command is, the more data is stored in kernel memory and the longer a read will block. This rate can be adjusted with the -M <value> command line parameter. The <value> is in hundredths of a second; for example, 200 is every two seconds. If the flush rate is set to a very short interval (0.01 seconds is the minimum allowed), then Prospect will stop sampling very shortly after the child application terminates. If however, the flush rate is longer then it can take up to that amount of time before Prospect stops sampling after the child application exits. And of course, there is more system intrusion for faster flush rates.
The files linux_module.c and linux_module.h hold the functions and definitions that interface with the oprofile module. The file rec_proc.c orchestrates the sequence for data collection.
Most data used in Prospect is kept in a data structure called a Digital Tree and is called dtree in the code. The name trie is synonymous with this. This data structure is discussed by Knuth[Knuth] in his third volume of The Art of Computer Programming. The trie lends itself very well to managing sparse data, and the data that Prospect collects is sparse consisting mainly of: (1) process structures indexed by PID, and (2) instruction pointer hits indexed by memory address. The concept is easily stated: the value of the index is implied in the structure of the trie itself. The subdirectory dtree holds all the files for this implementation.
Prospect happens to use a quaternary trie. This means that there are four items in each node and so 2 bits translate each node path. This equates into a trie that can be 16 levels deep for a 32-bit entity (32 levels for 64 bits). Because of the quaternary nature, five consecutive indices will extend the 32-bit trie branch to the maximum level. This also means that five consecutive indices will extend the 64-bit version to its maximum level too since the current implementation does not double the order of the trie along with the word size for the 32- to 64-bit transition. This has not proven to be a performance burden yet.
Traversing the trie to find a value consists of repeatedly using the top two bits to choose which quaternary branch to follow and shifting up by two after the choice until a value is arrived at. If a node contains values, it is called a flower and since it is a quaternary trie, it can have up to four values in a flower.
The dtree module is used to store a void pointer at the leaf. This can be an actual pointer that points to some structure (as in the process structures indexed by PID), or it can just be used as a long variable to store a count (as for the number of hits indexed by memory address). The dtree functions return a void* that should be cast appropriately.
The dtree.h header file defines the following shortcut functions
for using the structure easily:
    Insert:   DTI(Pdt, Idx)
    Get:      DTG(Pdt, Idx)

    First:    DTF(Pdt, Idx)
    Next:     DTN(Pdt, Idx)
    Prev:     DTP(Pdt, Idx)
    Last:     DTL(Pdt, Idx)
In these definitions, Pdt should be a void pointer to a
dtree variable and Idx should be a long for index value.
Since the dtree module handles all memory management, setting up a
trie is as easy as declaring a NULL void pointer and inserting
the first value. For example, to add a certain amount of hits to a
counter variable indexed by address:
 void *hit_tree=NULL;
 void add_hits(int hits, char *addr) {
   int *hptr;
   hptr = (int*)DTI(hit_tree,
                   (unsigned long) addr);
   if (hptr) *hptr += hits;
 }
The DTI insert method (which stands for ``dtree insert'') will return
a pointer to a non-null quantity if an item at that index (addr
in the example above) exists, otherwise the returned pointer points
to NULL. The function will return an actual NULL only if
sbrk fails.
Using this method to store a pointer to an arbitrary structure is very similar as the following example shows.
struct big_struct **bs_ptr;
void *tree=NULL;

bs_ptr = (struct big_struct*)
         DTI(tree, 451);
if (*bs_ptr==NULL) {
    /* first insert */
    *bs_ptr=malloc(sizeof(big_struct));
    *bs_ptr->bs_member = 42;
}
else {
     *bs_ptr->bs_member += 42;
}
The next method is DTG which stands for ``dtree get''. This method
is used to query the trie if a value at an index is present. This
function will return a NULL if there is no value present, and a
pointer to the value if it is. For example:
int *var;
void *trie;
unsigned long PC;

/* some code here */

var = (int*) DTG(trie, 0x80004533);
if (var)
    printf("Value = %d\n,*var);
else
    printf("No value at 0x80004533\n");
The next two dtree functions form the mechanism for the common
way to extract all information out of the trie. These are DTF
(for ``dtree first'') and DTN (for ``dtree next''). An actual code
example from Prospect follows. Here we pull out all instruction pointer
hits for a particular region for a particular process.
#typedef unsigned long ul;
process_t *p;
ul *P;
...
/* extract profile and build table */
for (Index=0L,
     P = (ul*) DTF(p->pr_profile, Index);
     P != (ul*) NULL;
     P = (ul*) DTN(p->pr_profile, Index)
    )
{
  if (*P == 0) {
    mBUG("*P=0 on user profile extract");
    continue;
  }
  BuildUserSymbolTbl(Index, (ul) *P, p);
}
The function BuildUserSymbolTbl does the work of building
a profile table and is called for every address in the profile with the
amount of hits to that address. Note that these dtree methods
(DTF,DTN,DTP,DTL) expect a variable for the Index argument.
This is because the methods set that variable to the index where the
returned value is found.
Note also that all the dtree access methods actually return a pointer to a pointer, thus casting is necessary to get things right.
Not much performance analysis was done on the dtree structure itself, however, recognizing some patterns in the incoming data allowed performance upgrading of the method overall by putting a small cache in front of the trie. This is especially useful for the process structure indexed by PID trie, and as it happens, the cache is not used for the hits indexed by memory address tries.
The software cache size was selected to match the cacheline size
of the machine: the cache is used to hold four indices and four
corresponding values. At machine word length, this corresponds to a
32-byte cacheline for a 32-bit machine, and a 64-byte cacheline for a
64-bit machine. This cache can then store up to four index/value pairs.
Every time through the cached lookup routine, we first see if the index
that is asked for is in the cache. If it is, the corresponding value
is returned out of the cache. If it is not, then we do a true lookup
and afterwards, we choose a index/value pair at random in the cache and
replace it with the new value. The value looked up is then returned. The
random generator is the lower two bits of the free-running counter -
the TSC on an IA32 chip, and AR44 register on IPF.
Even though the item replacement is random, the cache is quite effective. You can turn on some statistics output by uncommenting the #define PERFTEST line in the prospect.h header file and running prospect on any load.
The initial HP-UX implementation of Prospect had a built-in disassembler for the PARISC instruction set. This was a fixed-size instruction set and table driven. For the IA32 port the instruction set was rather different and instructions were no longer of fixed size. After realizing that GDB provides a nice disassembly facility and that when Prospect was disassembling instructions and generating the IPD (Instruction Profile Disassembly) profiles, it was in a non-performance-critical stage, we decided to create a wrapper around this GDB facility.
Use of this wrapper allows the programmatic symbolic disassembly of any binary file on the system and its use is almost transparent when moving from IA32 to IPF as well. The wrapper uses normal Unix pipes to open a GDB process, send it disassembly commands, and read back the disassembled instructions. Prospect includes code for managing many such open pipes to separate GDB processes. The subdirectory dass_gdb contains the files that implement the wrapper.
The dass_gdb wrapper defines the following functions as its interface:
 void  *dass_open(const char *filename);
 char **dass(void *handle, char *begin,
             char *end);
 void   dass_free(char **array);
 int    dass_close(void *handle);
These functions perform the following services.
The dass() function returns a list of strings as the return value. Or rather, a char** through which the caller can access this list. It is up to the caller to free the memory used for the list of strings once the caller is done with it. Freeing this memory is done with the next function das_free().
Each GDB process can take 3.2 to 3.6 megabytes of memory on average. Since a Prospect output can have potentially hundreds (perhaps even thousands) of separate files associated with regions for all processes that ran during the sampling period, having this many running GDB processes at once can bog the system down. At the same time, you don't want to start and stop a single GDB process every time the profile switches to a different executable or library since that would add a distasteful overhead to this process.
If we further examine Prospect output, then we see some more things that can be used to advantage. For example, a large number of files are used repeatedly for many processes (the shared libraries), and if processes are repeatedly run, all of their disassembled output comes from the same files. What we needed was a way to hold open a number of GDB processes, set at a reasonable default and configurable by the user. Thus, Prospect uses a most-used-first queue of open pipes to running GDB processes with the number of simultaneously opened pipes set by the -g <number> parameter.
The way this rolling queue works is as follows. When a file is to be disassembled, Prospect first tries to find an open pipe to a GDB process for that file in the queue by linear search through the queue. If a pipe tied to the desired filename is found, then Prospect moves that pipe to the head of the queue. If the pipe is not found, then Prospect opens a pipe to a GDB for that file with a call to das_open(). The pipe is then inserted at the head of the queue. At this point, Prospect checks if there are too many open pipes according to the -g <number> parameter, and if there are, Prospect closes the pipe held at the tail of the queue.
Thus, the most often used files for disassembly gravitate toward the front of the queue and are found quicker than the less often used files. The length of the queue determines how many simultaneous pipes to GDB processes are held open and is user configurable. If you set the -g <number> parameter to 1 (one), then this mechanism will open and close a GDB process for every file encountered even if it's the same file. This saves memory but costs time in the open/close process overhead. If you set the parameter to a high number, then that many open pipes (and hence running GDB processes) will be held open. This will improve run-time performance, but will cost memory. The default amount of slots in the queue is set to 8. See the file incache.c for details on this queue implementation.
Besides its obvious use in profiling single benchmark and application programs, Prospect is also useful for insight into the behavior of the whole system during interesting workloads. In this example, the netperf benchmark will be used to create a multi-process kernel-intensive workload and we'll explore Prospect's ability to see what's going on.
Our workload is created by this script:
  for i in 1 2 3 4
  do
   netperf -t TCP_RR -H isv204 -l 60 \
           -P 0 -v 0 &
  done
  wait
This starts four simultaneous netperf request-response runs to remote server isv204, instructing each to run for 60 seconds. The script ends when all the netperf processes have exited.
A timed run of the netperf4.sh script shows:
2.94user 57.08system 1:02.10elapsed 96%CPU
To profile everything on the system while this script runs, a typical Prospect command line would be:
 $ prospect -f prospect.out -V4 -H1000 \
            ./netperf4.sh >netperf.out 2>&1
The -V4 option says to trace all active processes on the system during the duration of the command ./netperf4.sh. Prospect will produce a user and kernel profile for each process that meets the CPU time threshold, plus a global profile of the time spent in the kernel. The -H1000 option sets a sample rate of 1000 samples/sec.
Alternately, if the workload were ongoing, or not easily startable from Prospect, you could obtain the full system profile by ``profiling'' a sleep command of the desired duration:
  $ prospect -f prospect.out -V4 \
             -H1000 sleep 60
The oprofile module provides Non-Maskable Interrupt (NMI) sampling on hardware platforms that support it, and Prospect normally sets it up to use CPU clock cycle counting to generate the interrupts that collect the IP samples. On platforms where oprofile doesn't support NMI sampling, the Real-Time Clock (RTC) hardware can be used to generate sample interrupts. RTC sampling is most useful for profiling user-mode execution on uniprocessor systems. Since it doesn't use a Non-Maskable Interrupt, it has a blind-spot in kernel mode that will be illustrated in our example: RTC sampling can't catch execution in other interrupt handlers.
What do CPUs do when there is nothing useful to do? They execute an idling routine in the kernel and wait to be interrupted with useful work. On most i386 Linux systems, the cpu_idle and default_idle routines in the kernel are where they wait. The implementation of default_idle can create an interesting problem for Prospect with NMI sampling. The default_idle routine uses the HLT (halt) instruction to stop the CPU while it waits for something to do. But the CPU_CLK_UNHALTED counter used to generate the NMI sampling is so named because it does not advance when the CPU is halted. Sampling just stops when the CPU halts and Prospect doesn't know it. That part of the idle time simply disappears from the profile. The interrupts used by RTC sampling are driven by elapsed time, so the halted CPU is awakened from its halted state and sampled, effectively caught in the default idle routine. But, as mentioned before, RTC sampling has other problems sampling the kernel.
Because of some hardware bug of long ago, Linux provides a boot parameter that allows NMI sampling to see idle time. Appending ``no-hlt=1'' to the boot string in lilo.conf causes default_idle to become part of a time-wasting loop instead of halting the CPU, and allows Prospect to show us the idle time as hits in the cpu_idle and default_idle routines.
The results below came from three different Prospect runs: Default NMI mode, RTC mode, and NMI mode on a no-hlt=1 kernel. Since the RTC sample rates are limited to powers of 2, we used -H1024 for all runs so we can compare hit counts as well as equivalent times. Here are some highlights from the Prospect output for the netperf workload:
The ``Statistics of Run'' section has stats on the operation of Prospect itself. Three counts are of interest here:
         Num samples   System Hits   User hits
----------------------------------------------
Default        61667         58579        3088
RTC            65024         61798        3226
No-hlt         65657         62658        2999
----------------------------------------------
Note that the Default case appears to be missing 3 or 4 seconds worth of 1024 Hz samples. We'll see why later. We can also see that user time is not a significant part of this workload.
The output that Prospect provides is quite extensive. For clarity of presentation, we only reproduce the relevant parts of the output in this document.
This section summarizes all processes seen during the profiling period, dropping the ones that don't meet the CPU usage thresholds (configurable with -k and -m options). The two methods produce similar results:
 Default NMI sampling:
 Process     User Hits/Time   System Hits/Time
 ---------------------------------------------
 netperf       728   0.7109     14838  14.4902
 netperf       709   0.6924     14197  13.8643
 netperf       679   0.6631     14140  13.8086
 netperf       666   0.6504     14557  14.2158
 prospect      301   0.2939       769   0.7510
 bash            5   0.0049         2   0.0020
 ---------------------------------------------

 RTC sampling:
 Process     User Hits/Time   System Hits/Time
 ---------------------------------------------
 netperf       776   0.7578     14634  14.2910
 netperf       768   0.7500     14253  13.9189
 netperf       699   0.6826     14442  14.1035
 netperf       698   0.6816     14335  13.9990
 prospect      278   0.2715        28   0.0273
 bash            6   0.0059         4   0.0039
 ---------------------------------------------
The No-hlt NMI case is not significantly different than the Default case in this section. The missing System Time in the Default case does not show up in the process summary.
Note also that Prospect sees and reports its own overhead, but some parts of the oprofile module necessarily run with sampling disabled, so indirect methods would be required to assess the complete effect of profiling.
After the summary, each eligible process is profiled in user mode and in kernel (or system) mode. Although we see from the summary that user mode execution is not a significant contributor to CPU time in this workload, there are a couple of interesting points.
The four netperf user profiles are expectedly similar, showing these three routines and their files:
send_tcp_rr in /usr/local/netperf/netperf
recv->recvfrom in /lib/libc-2.2.4.so
send->sendmsg  in /lib/libc-2.2.4.so
The libc shared library is stripped, so Prospect shows the enclosing symbols from the dynamic symbol table as a range to emphasize that there is some uncertainty. In other words, samples occurred between the recv and recvfrom entries, and between send and sendmsg, but without the normal symbol table, Prospect can't know what static functions might exist in that range. A greater (and possibly too much greater) level of detail within these ranges could be seen by specifying disassembly. Otherwise, linking static or building unstripped shared libraries would also reveal more detail in the user mode profile.
To compare the NMI and RTC sampling methods, here are the user hits reported for the top routines of each netperf process in the USER portion of profile:
  Default NMI sampling:
  Routine name   Hits  Hits  Hits  Hits
  -------------------------------------
  send_tcp_rr     410   401   382   376
  recv->recvfrom  167   158   155   158
  send->sendmsg   145   140   134   126
  -------------------------------------
  Total           722   699   671   660

  RTC sampling:
  Routine name   Hits  Hits  Hits  Hits
   -------------------------------------
  send_tcp_rr     387   373   359   352
  recv->recvfrom  222   194   178   189
  send->sendmsg   163   194   158   153
  -------------------------------------
  Total           772   761   695   694
Results with the No-hlt kernel are not significantly different than the NMI results shown here. The big differences in the three methods show up in the Kernel portions of the process profiles and in the Global Kernel profile.
Here are the kernel (or system) hits reported for the top kernel routines of each netperf process in the KERNEL portion of profile:
 Default NMI sampling:
 Routine name      Hits  Hits  Hits  Hits
 ----------------------------------------
 speedo_interrupt  1411  1313  1354  1345
 tcp_sendmsg        686   659   616   654
 speedo_rx          517   529   544   587
 ...
 speedo_start_xmit  482   491   452   465
 ...
 do_softirq         223   200   226   219
 ...
 ----------------------------------------

 RTC sampling:
 Routine name      Hits  Hits  Hits  Hits
 ----------------------------------------
 do_softirq        2693  2698  2709  2681
 speedo_start_xmit 1422  1383  1425  1339
 tcp_sendmsg        665   700   696   650
 ...
 ----------------------------------------
Once again, NMI no-hlt sampling was not significantly different from Default NMI sampling. But as you can see, the profile of the top routines in the RTC version differs significantly from that in the NMI version. While the top two RTC routines do show up in the NMI version with lower hit counts, the two speedo routines in the top three of the NMI version don't show up in the RTC profile at all.
The routines that are missing from the RTC profile are part of the interrupt handler for the eepro100 network driver. They show up under the netperf process KERNEL profile because the interrupt came in when that process was on the CPU. Other routines shown under the process KERNEL profile are actually there as a result of system calls made by the process, but you can't currently tell which are which without knowing something about the code.
As an example of how an ``innocent'' process can have its profile ``corrupted'' in this way, a background cpuspin program was run at a nice priority throughout another netperf workload. When running alone on a system, the cpuspin program normally gets 0.06 seconds of system time in a run that consumes 58 seconds of user CPU time. But during the netperf run interval, Prospect reported that the background cpuspin program picked up 7.3 seconds of user time and 3.9 seconds of system time. The KERNEL portion of cpuspin's profile showed these routines at the top:
   Routine name      Hits
   ----------------------
   speedo_interrupt   714
   speedo_rx          397
   schedule           269
   uhci_interrupt     259
   tcp_v4_rcv         210
   net_rx_action      173
   ...
   ----------------------
You can see how this could mislead you into believing something about the cpuspin program that wasn't actually true.
Now it's time to get back to the missing system time in the Default NMI sampling method. The last section of a -V4 Prospect report is the Global KERNEL Profile. It provides a single profile of all system hits in the run. Here are the top routines:
  Default NMI sampling:
  Routine name      Hits
  ----------------------
  speedo_interrupt  5436
  tcp_sendmsg       2615
  speedo_rx         2182
  uhci_interrupt    1978
  speedo_start_xmit 1890
  schedule          1777
  tcp_recvmsg       1623
  __rdtsc_delay     1366
  ...
  default_idle        11
  ...
  ----------------------

  No-hlt NMI sampling:
  Routine name      Hits
  ----------------------
  speedo_interrupt  5556
  tcp_sendmsg       2612
  speedo_rx         2202
  default_idle      2070
  cpu_idle          1945
  speedo_start_xmit 1944
  uhci_interrupt    1929
  schedule          1716
  tcp_recvmsg       1596
  __rdtsc_delay     1414
  ...
  ----------------------
Hit counts are pretty similar except for the two idle routines. The No-hlt kernel allows Prospect to see 4015 hits in the idle routines, while it only saw 11 hits in the Default NMI case. The reported difference in system hits between the two runs was 4079, so we have the culprit. The RTC version still insists that do_softirq is the top kernel routine, but at least it does attribute 4010 hits to default_idle.
A disassembly (-e) run with RTC sampling showed that in the do_softirq routine, a huge concentration of hits occurred in a three-instruction cluster consisting of:
  Hits   Address          Instruction
  -----------------------------------
  4117   <do_softirq+77>: lea 0x0(%esi),%esi
    94   <do_softirq+80>: test   $0x1,%bl
  2961   <do_softirq+83>: je <do_softirq+93>
This doesn't make a lot of sense until you look at the two instructions just before these:
  <do_softirq+74>: sti
  <do_softirq+75>: mov %ebp,%esi
The sti instruction allows the processor to start responding to external maskable interrupts after the next instruction is executed. With RTC sampling, the sample is taken when the interrupt is allowed to occur, not when the real time clock wants it to occur. In this case it was held off until after the sti instruction in do_softirq. NMI isn't held off at all, so the real kernel profile can be seen.
These runs were performed on a 2.4.14 uniprocessor kernel. NMI sampling works well on SMP as well, reporting times that are multiplied by the number of CPUs running. RTC sampling is not as reliable on SMP systems, since each interrupt is processed by only one of the CPUs. The accuracy of the resulting profile depends on the RTC interrupts being distributed evenly across the CPUs.
The drivers on this kernel were built in, not loaded as modules. Prospect can not currently provide profiles of kernel modules, but that capability should be available Real Soon Now.
A number of people have contributed in many ways to this project, not the least of which are: Doug Baskins, Keith Fish, Michael Morrell, and Bob Metzger, all of whom are at HP.
We would also like to thank John Levon for writing such cool software and putting it under GPL.
This document was generated using the LaTeX2HTML translator Version 2K.1beta (1.48)
Copyright © 1993, 1994, 1995, 1996,
Nikos Drakos,
Computer Based Learning Unit, University of Leeds.
Copyright © 1997, 1998, 1999,
Ross Moore,
Mathematics Department, Macquarie University, Sydney.
The command line arguments were:
latex2html -split 0 prospect.tex
The translation was initiated by Debian User on 2002-07-22
The output was also modified by Debian User on 2002-07-22